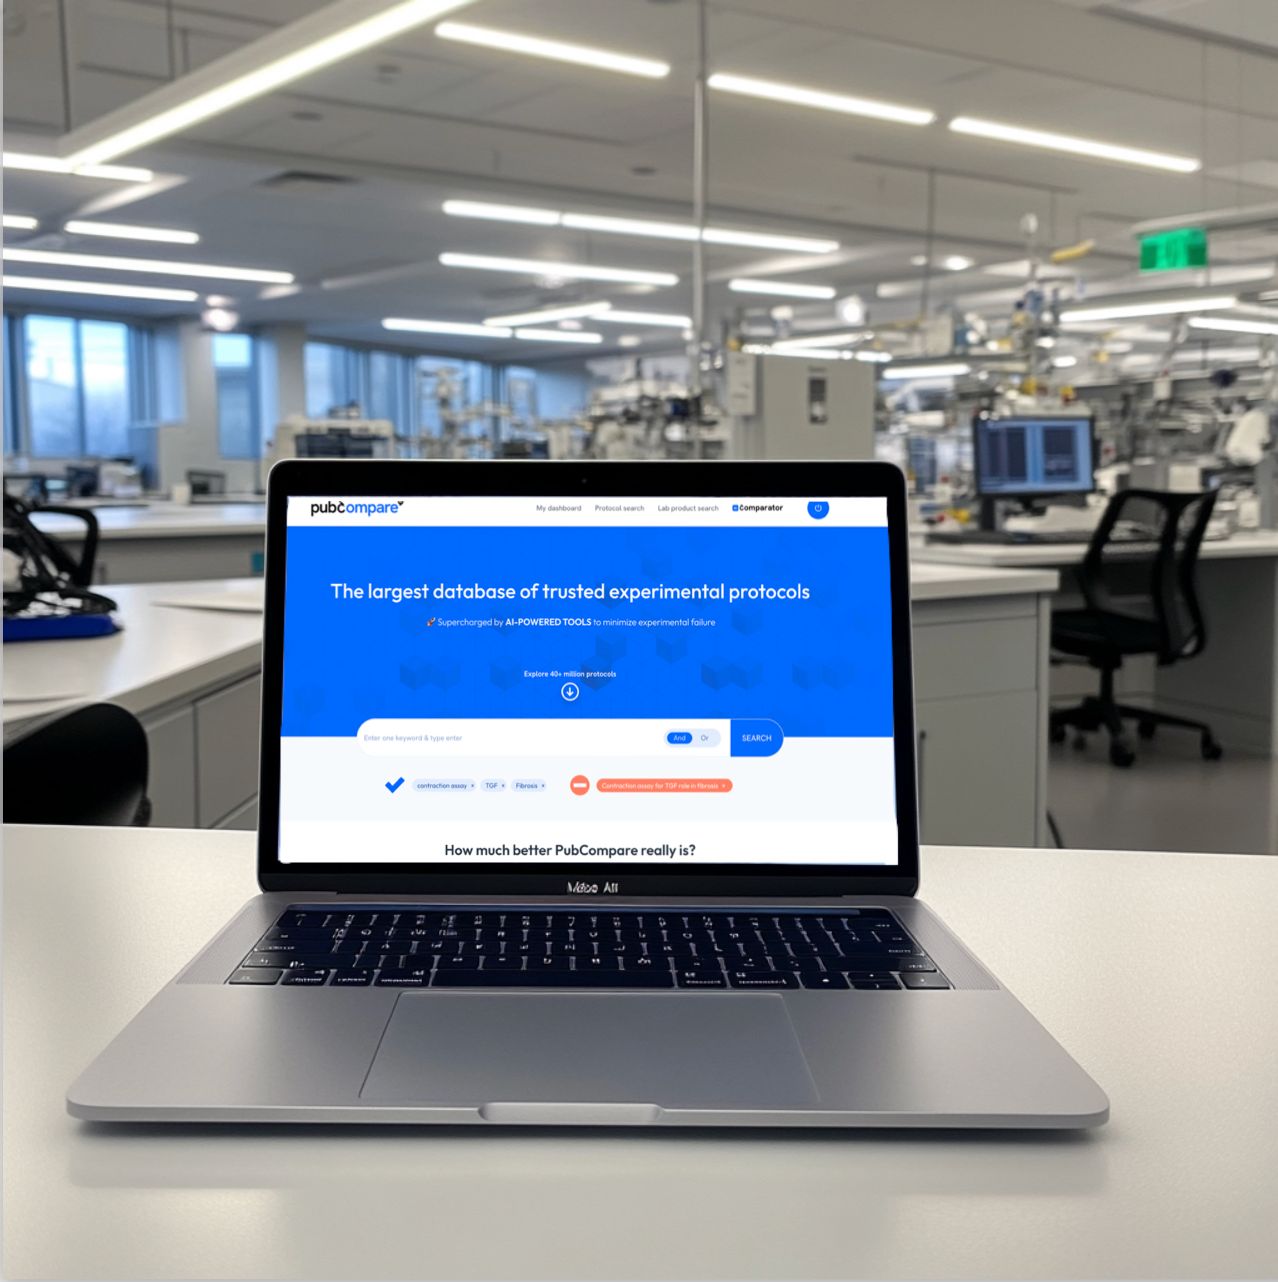
The largest database of trusted experimental protocols

606 protocols using odyssey imager

1

Osteoclast Protein Phosphorylation Profiling

Check if the same lab product or an alternative is used in the 5 most similar protocols
To study phosphorylation and expression of proteins in osteoclasts, BMMs were induced with RANKL for different time points as described in the figures and the total cell lysates were prepared in cell lysis buffer (Cell Signaling Technology, Danvers, MA, USA). Protein concentration was determined and equal amount of protein was applied onto SDS-PAGE. After the transfer, membranes were blocked in 5% skimmed milk for 1 h at room temperature, followed by probing with specific primary antibody primary antibodies in 5% BSA in PBS-Tween (1% v/v) overnight and then washed three times with PBS-Tween (PBST) and probed with secondary antibodies from LI-COR (Odyssey Imager; donkey anti-rabbit/IRDye 800 CW/anti-goat/IRDye 800 CW anti-mouse IRDye 680 CW) for 1 h at room temperature. Membranes were then washed three times with PBST and scanned by using LI-COR Odyssey Imager (LI-COR Biosciences, Lincoln, NE, USA). The RBPJ, NEMO, IKK2, pIκB, IκB and cleaved PARP1 antibodies were purchased form Santa Cruz, Dallas, TX, USA; Cleaved Caspase 3 antibody was purchased from Cell Signaling Technology, Danvers, MA, USA; β-actin was purchased from Sigma, St Louis, MO, USA.
+ Open protocol
+ Expand
2

Immunoblotting Protein Detection Protocol

Check if the same lab product or an alternative is used in the 5 most similar protocols
Cells were harvested at times indicated in lithium dodecyl sulfate (LDS) sample buffer and incubated at 95°C for 10 min. Protein samples were run on NuPAGE 4–12% bis-Tris gels (Invitrogen). Proteins were transferred from the gel to nitrocellulose or PVDF membranes for imaging via LI-COR Odyssey imager (Lincoln, NE) or film, respectively. Membranes were blocked in either LI-COR blocking solution or 5% powdered milk-PBS containing 0.1% Tween 20 (PBST) for 1 hr. After blocking, membranes were incubated with primary antibody overnight at 4°C. Membranes were washed 3 times with PBST, incubated in secondary antibody for 1 hr at room temperature (IRDye 800CW Goat anti-Mouse IgG and IRDye 800CW Goat anti-Rabbit IgG for LI-COR; α-mouse IgG+HRP and α-Rabbit IgG+HRP, Cell Signaling 7076 s and 7074 s, respectively for film). Membranes were washed 3 times in PBST. Nitrocellulose membranes were imaged with a LI-COR Odyssey imager. PVDF membranes were incubated with SuperSignal West Pico chemiluminescent substrate (Thermo Scientific) and exposed to film.
+ Open protocol
+ Expand
3

Evaluating Protein Expression in AFSCs

Check if the same lab product or an alternative is used in the 5 most similar protocols
The effects of metformin and LPS on the expression of specific proteins of AFSCs were also assessed by western blot analysis. Following 5 days of culture with four different conditions, the protein was extracted from the cells using a lysis buffer (Thermo Scientific, Cat. #78501, Pittsburgh, PA). In order to ensure equal loading, the total protein concentration in each sample was measured by a BCA protein assay kit (Thermo Scientific, Cat. #23225, Pittsburgh, PA). A total of 30 μg protein was separated in 10% SDS gels by PAGE prior to their transfer to PVDF membranes (Bio-Rad, Hercules, CA). The blots were blocked using 5% Non-Fat dry milk (Bio-Rad, Hercules, CA) at room temperature for 1 h and subsequently incubated at 4°C overnight with primary antibodies against TNF-α (Cell Signaling, 1:1,000), IL-β1 (Cell Signaling, 1:1,000), COX-2 (Cell Signaling, 1:1,000) and β-actin (Abcam, 1:10,000). The following day, the blots were washed three times with PBS-T buffer and incubated with the corresponding secondary antibodies (LI-COR Biosciences, 1:15,000) for 1 h at room temperature. Following another three washes with PBS-T, the blots were subjected to the LiCoR Odyssey imager (LI-COR Biosciences, Lincoln, NE) for visualization of the protein bands, and semi-quantification was performed using the software of the LiCoR Odyssey imager.
+ Open protocol
+ Expand
4

Osteoclast Differentiation and Signaling

Check if the same lab product or an alternative is used in the 5 most similar protocols
BMMs and/or pre-OC (BMMs treated with RANKL for 2 days) were lysed in cell lysis buffer (Cell Signaling Technology, Danvers, MA, USA) post treatments. Protein concentration was determined using BCA (Pierce, Invitrogen) and equal amounts of protein was loaded onto SDS-PAGE. After transfer, and blocking in 5% BSA for 1 hr at room temperature, membranes were probed with primary antibodies in 5% BSA in PBS-Tween (1% v/v) for overnight and then washed with PBS-Tween (3x) and probed with secondary antibodies from LI-COR (Odyssey Imager; donkey anti-rabbit and anti-mouse) for 1 hr at room temperature. Membranes were then with PBST (3x) and scanned by using LI-COR Odyssey Imager (LI-COR Biosciences, Lincoln, NE, USA). Western blots were also performed (for LC3 and actin) using capillary-based immunoassay using the Wes-Simple Western method with the anti-rabbit detection module (Protein Simple). Protein expression was measured by chemiluminescence. The NEMO and ISG15 antibody were purchased from Santa Cruz, Dallas, TX, USA; phos-p65, p65 and LC3 antibodies were purchased from Cell Signaling Technology, Danvers, MA, USA; Flag and β-actin was purchased from Sigma, St. Louis, MO, USA.
+ Open protocol
+ Expand
5

Western Blot Analysis of Collagen II and CA12

Check if the same lab product or an alternative is used in the 5 most similar protocols
Protein extracts from NPMSCs were prepared in 2 × SDS lysis buffer containing phosphatase and proteinase inhibitors. Protein extracts were subjected to 6% or 12% SDS-PAGE. Protein was separated and then transferred to a polyvinylidene fluoride membranes by electroblotting. The membrane was rinsed in water and blocked with freshly prepared PBS containing nonfat dry milk (5%) for 60 min at room temperature with constant agitation. The membrane was then incubated with human type II collagen (1:5000, Abcam, UK) and CA12 (1:1000, Abcam, UK) antibodies overnight at 4 °C with agitation. After washing the membrane three times with PBS-T, a secondary goat anti-mouse horseradish peroxidase (HRP)-conjugated antibody was added and incubated at room temperature for 2 h. Following another three washes with PBS-T, protein bands were visualized using the LiCoR Odyssey imager (LI-COR Biosciences, Lincoln, NE, USA), and semiquantification was performed using the LiCoR Odyssey imager software.
+ Open protocol
+ Expand
6

Western Blot Analysis of Signaling Proteins

Check if the same lab product or an alternative is used in the 5 most similar protocols
Total cell lysates were prepared in cell lysis buffer (Cell Signaling Technology, Danvers, MA, USA) from either Plat-E cells expressing different genes or Bone marrow cells induced with RANKL and/or TNFα for different time points as described in the figures). Protein concentration was determined and equal amount of protein was loaded onto SDS-PAGE. After transfer, and blocking in 5% BSA for 1 h at room temperature, membranes were probed with specific primary antibody primary antibodies in 5% BSA in PBS-Tween (1% v/v) for overnight and then washed three times with PBS-Tween (PBST) and probed with secondary antibodies from LI-COR (Odyssey Imager; donkey anti-rabbit/IRDye 800CW/anti-goat/IRDye 800CW anti-mouse IRDye 680RD) for 1 h at room temperature. Membranes were then washed three times with PBST and scanned by using LI-COR Odyssey Imager (LI-COR Biosciences, Lincoln, NE, USA). The NEMO, TRAF6, NUMBL, NFATc1 and TAK1 antibodies were purchased from Santa Cruz, Dallas, TX, USA; K48-Ub antibody was purchased from Cell Signaling Technology, Danvers, MA, USA; β-actin was purchased from Sigma, St Louis, MO, USA.
+ Open protocol
+ Expand
7

Western Blot Analysis of Mitochondrial OXPHOS

Check if the same lab product or an alternative is used in the 5 most similar protocols
Protein concentrations of isolated mitochondria samples were determined by BCA Protein Assay Kit according to the vendor protocol (Pierce Chemical Co., Dallas, TX, USA). For Total OXPHOS protein detection, 5 μg of protein from each isolated mitochondria sample was separated using sodium dodecyl sulfate polyacrylamide gel electrophoresis with a 15% SDS-PAGE gel. Protein was transferred to a PVDF membrane in transfer buffer (25 mM Tris, 192 mM glycine, 20% methanol; Bio-Rad Laboratories, Hercules, CA, USA). After drying the membrane for 1 h at room temperature, membranes were incubated in Revert 700 total protein stain (LI-COR Biosciences, Lincoln, NE, USA) and total protein was detected as a loading control using the LI-COR Odyssey Imager (LI-COR Biosciences, Lincoln, NE, USA). The membrane was then blocked with 5% nonfat dry milk in Tris-Buffered Saline for 1 h and incubated on a shaker overnight at 4 °C with primary antibody (1: 500; Total OXPHOS; Abcam, Cambridge, United Kingdom). After washing, the membrane was incubated for 1 h with fluorophore-conjugated secondary antibodies and bands were detected using the LI-COR Odyssey Imager (LI-COR Biosciences, Lincoln, NE, USA). Densitometric Analysis was carried out using the Licor Imager Software (LI-COR Biosciences, Lincoln, NE, USA).
+ Open protocol
+ Expand
8

Immunoblotting Analysis of Glutamate Receptor Subunits in Brain Regions

Check if the same lab product or an alternative is used in the 5 most similar protocols
Animals were sacrificed three days after induction of SDs via live decapitation. Fresh ipsilateral frontal cortex, parietal cortex, and hippocampus were dissected, flash frozen on dry ice, and stored at −80°C. Homogenized tissue samples were quantified via BCA assay and immunoblotting was performed. Briefly, protein was loaded into pre-cast gels, run at 200mV and transferred in a semi-dry transfer system. Membranes were incubated in REVERT Total Protein Stain for 5 minutes (LI-COR Biosciences #926–11010), washed, and imaged using Odyssey Imager and ImageStudio software (LI-COR) for later signal normalization to total protein (Aldridge et al. 2008 (link); Eaton et al. 2013 (link); Kirshner and Gibbs 2018 (link)). After incubation in destaining solution (LI-COR #926–11013), blots were then blocked for 1 hour, incubated in appropriate primary antibody overnight at 4°C (mouse anti-GluA1: 1:500, RRID:AB_2315840; mouse anti-GluA2: 1:500, RRID:AB_2232661; mouse anti-GluN2A: 1:250, RRID:AB_2315842; mouse anti-GluN2B: 1:250, RRID:AB_10673405; Antibodies, Inc), then washed, incubated for 1 hour at room temperature in secondary antibody (donkey anti-mouse IgG IRDye 800CW: 1:30,000, RRID:AB_2716622; LI-COR), and imaged with Odyssey Imager. Protein band signals were quantified using ImageStudio (LI-COR) and normalized to total protein stain.
+ Open protocol
+ Expand
9

Temporal Signaling Dynamics in C2C12 Myotubes

Check if the same lab product or an alternative is used in the 5 most similar protocols
Four-day differentiated C2C12 myotubes were treated at the time points indicated, washed twice in 1X PBS (Thermo Fisher Scientific), and lysed in radioimmunoprecipitation assay (RIPA) buffer (MilliporeSigma) on ice for 30 minutes. Cells were then scraped into 1.7mL Eppendorf tubes, centrifuged at 9000× g for 10 minat 4 °C, and supernatant collected. Protein lysates were quantified by BCA assay (Thermo Fisher Scientific) according to the manufacturer’s instructions. Equal amounts of protein were separated by SDS-PAGE (4%–15% TGX stain-free gel Bio-Rad, Hercules, CA, USA), and proteins transferred using the trans-blot turbo transfer system (Bio-Rad). The nitrocellulose membranes were probed with the following antibodies from Cell Signaling (Danvers, MA, USA), according to established Western blot protocols: p-STAT3 (#9145), STAT3 (#9139), p-STAT5 (#9351), STAT5 (#94205), p-SMAD2 (#3104), p-SMAD3 (#9520), SMAD2/3 (#8685), p-ERK1/2 (#4370), ERK1/2 (#4695), IκBα (#4814), p-p38 (#9216), p38 (#9212), and GAPDH (#2118). The secondary signal was quantified by fluorescence using a LI-COR Odyssey® imager (LI-COR Biosciences, Lincoln, NE, USA), and the signal was normalized to a GAPDH loading control.
+ Open protocol
+ Expand
10

Cytokine Profiling of JSCC Cell Secretome

Check if the same lab product or an alternative is used in the 5 most similar protocols
Conditioned media from 24-hour sera-deprived JSCC-1, JSCC-2 and JSCC3 cells were analyzed using the Proteome Profiler Human Cytokine XL Array (R&D Systems, Minneapolis, MN), with image capture and analyses via the Li-Cor Odyssey imager and Image Studio software (Li-Cor Biosciences, Lincoln, NE). Sera-free conditioned media for IL-6, VEGF, TGF-α and EGF were analyzed by ELISAs (R&D Systems, Minneapolis, MN), with data expressed as pg/106 cells.
+ Open protocol
+ Expand

About PubCompare

Our mission is to provide scientists with the largest repository of trustworthy protocols and intelligent analytical tools, thereby offering them extensive information to design robust protocols aimed at minimizing the risk of failures.

We believe that the most crucial aspect is to grant scientists access to a wide range of reliable sources and new useful tools that surpass human capabilities.

However, we trust in allowing scientists to determine how to construct their own protocols based on this information, as they are the experts in their field.

Ready to get started?

Sign up for free.
Registration takes 20 seconds.
Available from any computer
No download required

Sign up now

Revolutionizing how scientists
search and build protocols!